Developer Tools
The Developer Tools component is a runtime inspector for IC components. It opens a dedicated window where you can browse properties, monitor events, call methods, edit CSS, explore the DOM tree, and run MATLAB commands, all against a live component instance.
Launching the inspector
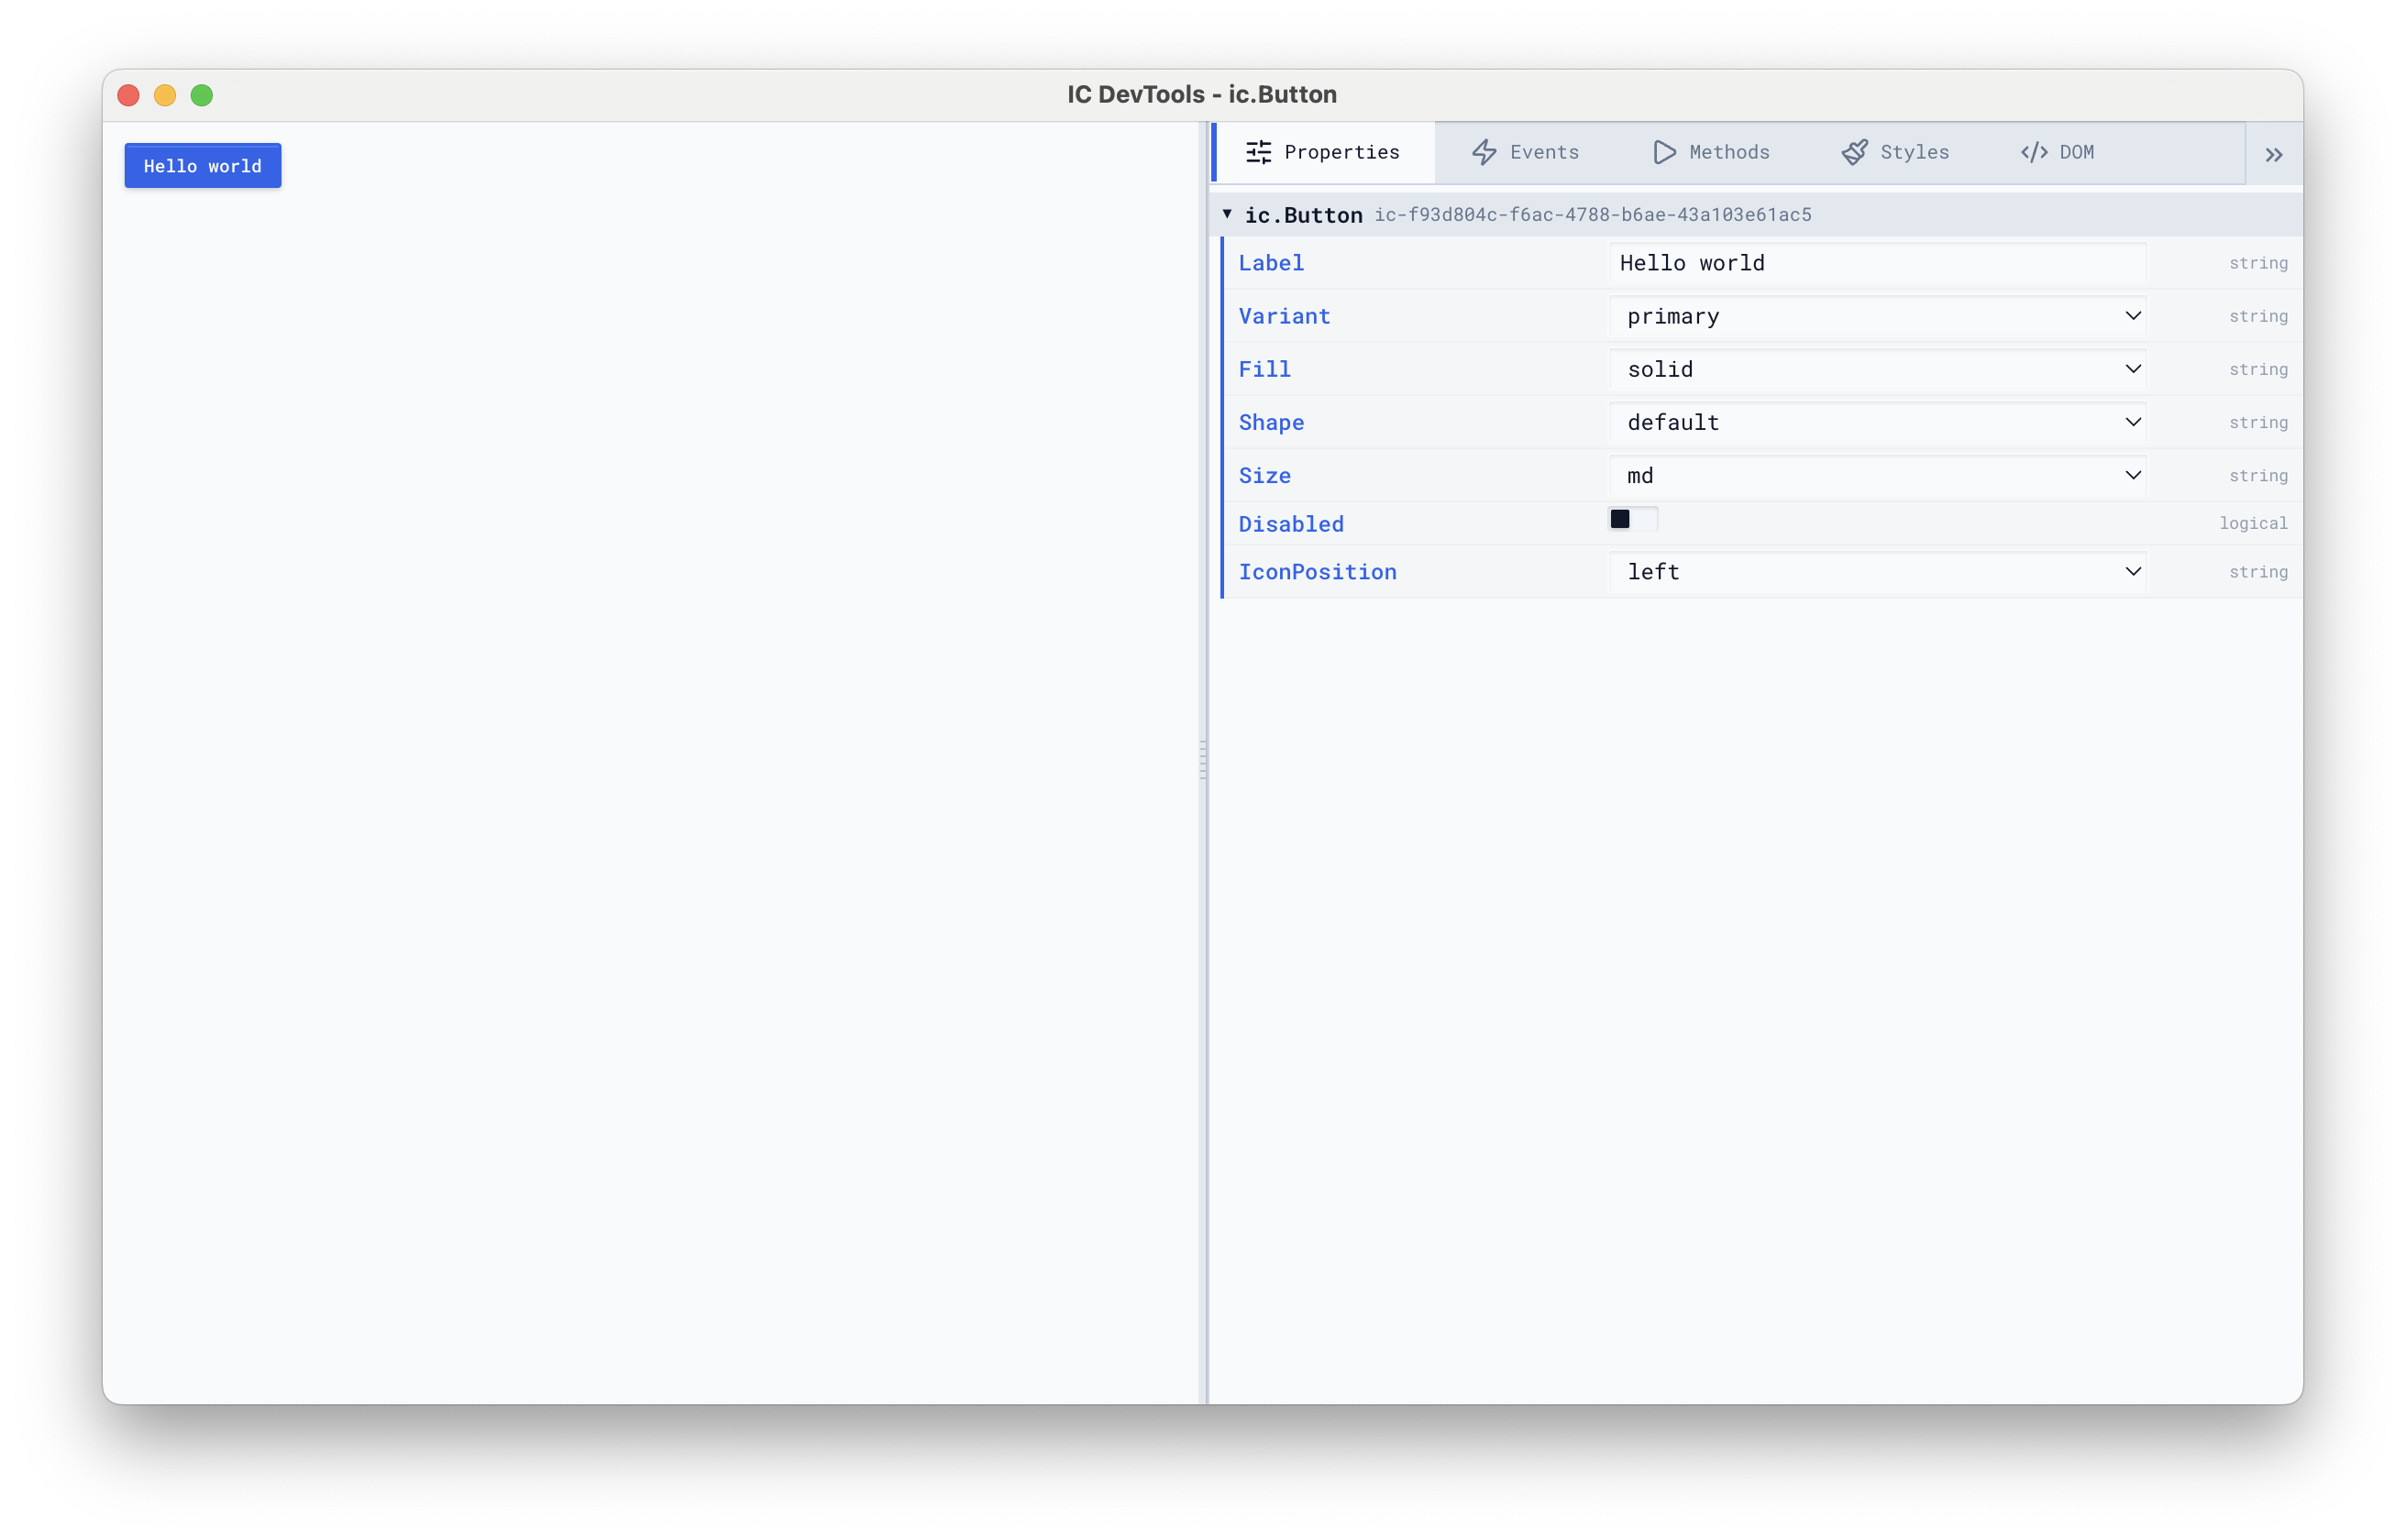
Pass any component to ic.DeveloperTools to open an inspector window. The component must not already be attached to a Frame: the inspector creates its own Frame and renders the component in a split-pane layout with the inspector panel on the right.
btn = ic.Button("Label", "Hello World");

dt = ic.DeveloperTools(btn);
The component appears on the left side of the window, fully interactive. The right side has six tabs: Properties, Events, Methods, Styles, DOM, and Console.
For containers with children, the inspector recursively shows the entire subtree:
flex = ic.FlexContainer("Direction", "row", "Gap", 10);
flex.addChild(ic.Button("Label", "Save"));
flex.addChild(ic.Slider("Value", 30));
flex.addChild(ic.ProgressBar("Value", 60));

dt = ic.DeveloperTools(flex);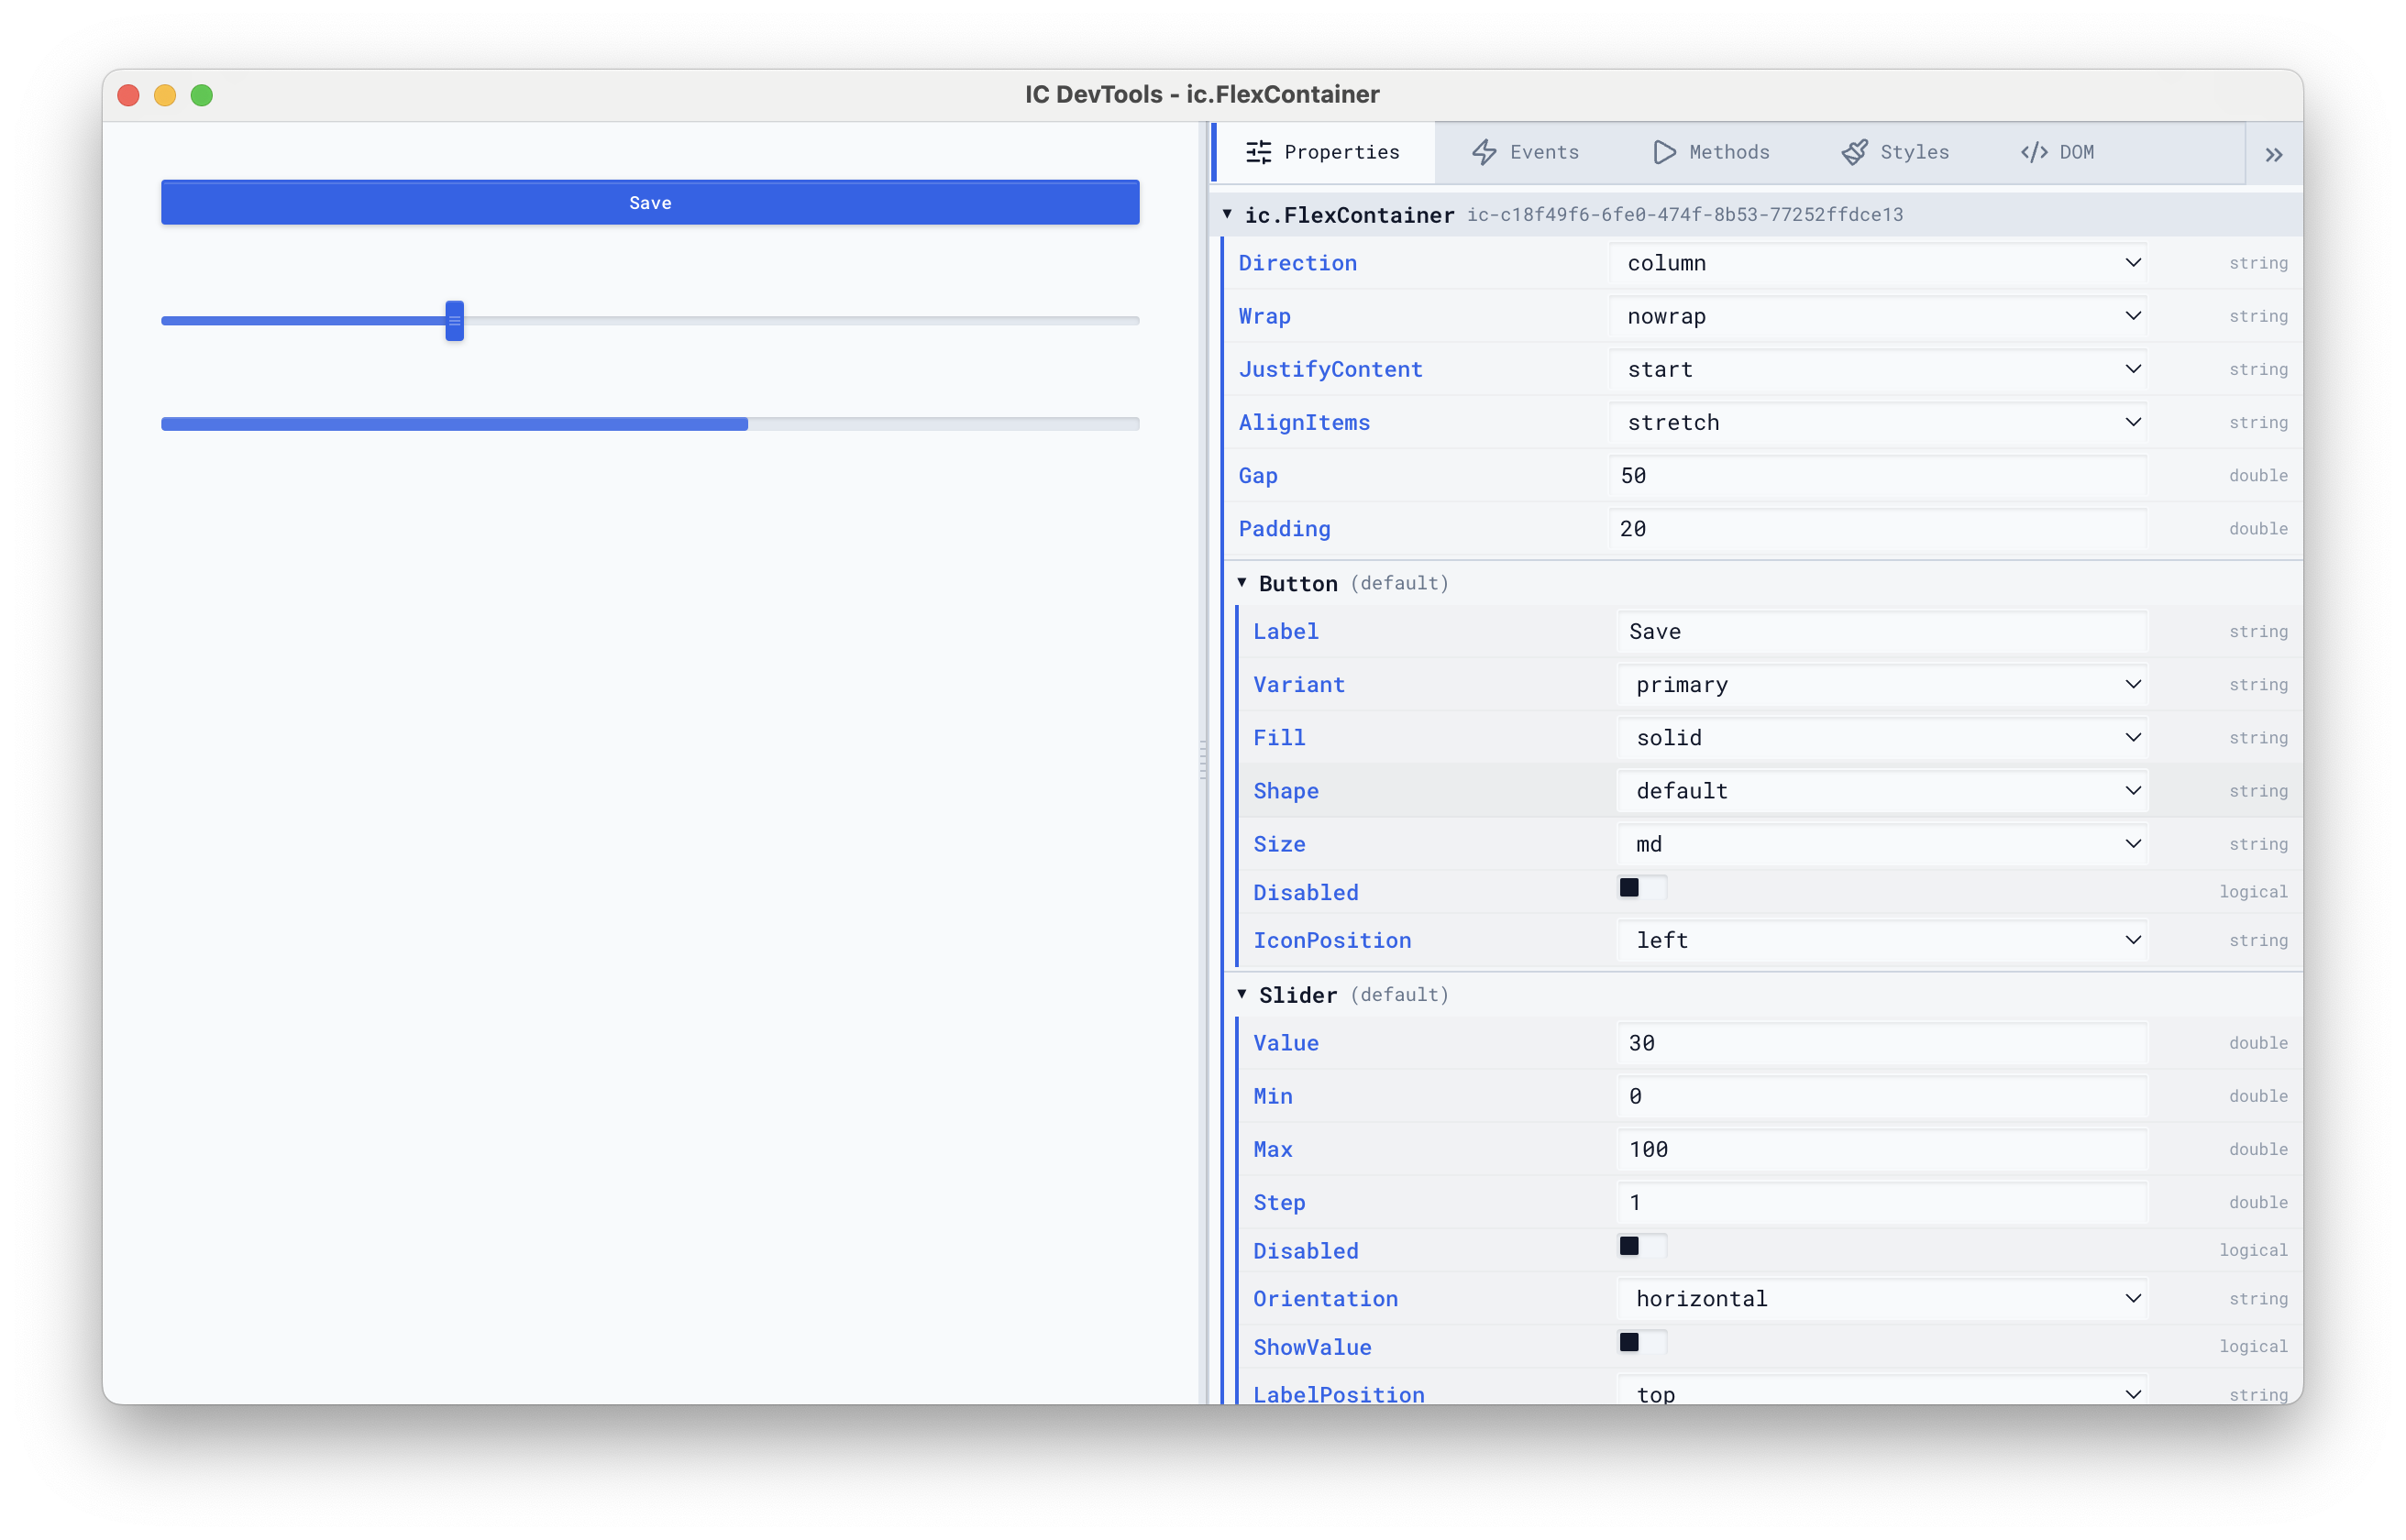
Properties
The Properties tab lists every reactive property on the component with its current value and type. Properties are editable directly in the inspector:
- Strings and numbers have text inputs
- Booleans have toggle switches
- Enumerations (properties with
mustBeMembervalidators) have dropdowns with the allowed values - Arrays can be expanded, and individual elements edited or removed
- Structs and objects expand recursively into nested property trees
Changes made in the Properties tab go through MATLAB’s property validation. If a value is rejected (out of range, wrong type), the inspector shows an error and rolls back the change.
Events
The Events tab monitors every reactive event on the component. Each event shows a live counter that increments when the event fires, and the payload of the most recent invocation.
This is useful for verifying that events fire when expected, inspecting their payloads, and checking that your listener logic aligns with what the component actually sends.
Methods
The Methods tab lists every reactive method. Methods that take no arguments have a Run button that executes them immediately. The result (success or error) is shown next to the button.
Methods that require arguments are listed but disabled, with a tooltip showing how many arguments they expect.
Styles
The Styles tab shows all CSS rules affecting the component, merged from three sources:
- Component rules: the styles defined in the Svelte template
- Dynamic rules: styles applied from MATLAB via
css.style() - Global rules: styles applied via
frame.globalStyle()
flex = ic.FlexContainer("Direction", "row", "Gap", 10);
btn = ic.Button("Label", "Styled");
btn.css.style("button", "background", "red", "color", "white");
flex.addChild(btn);
dt = ic.DeveloperTools(flex);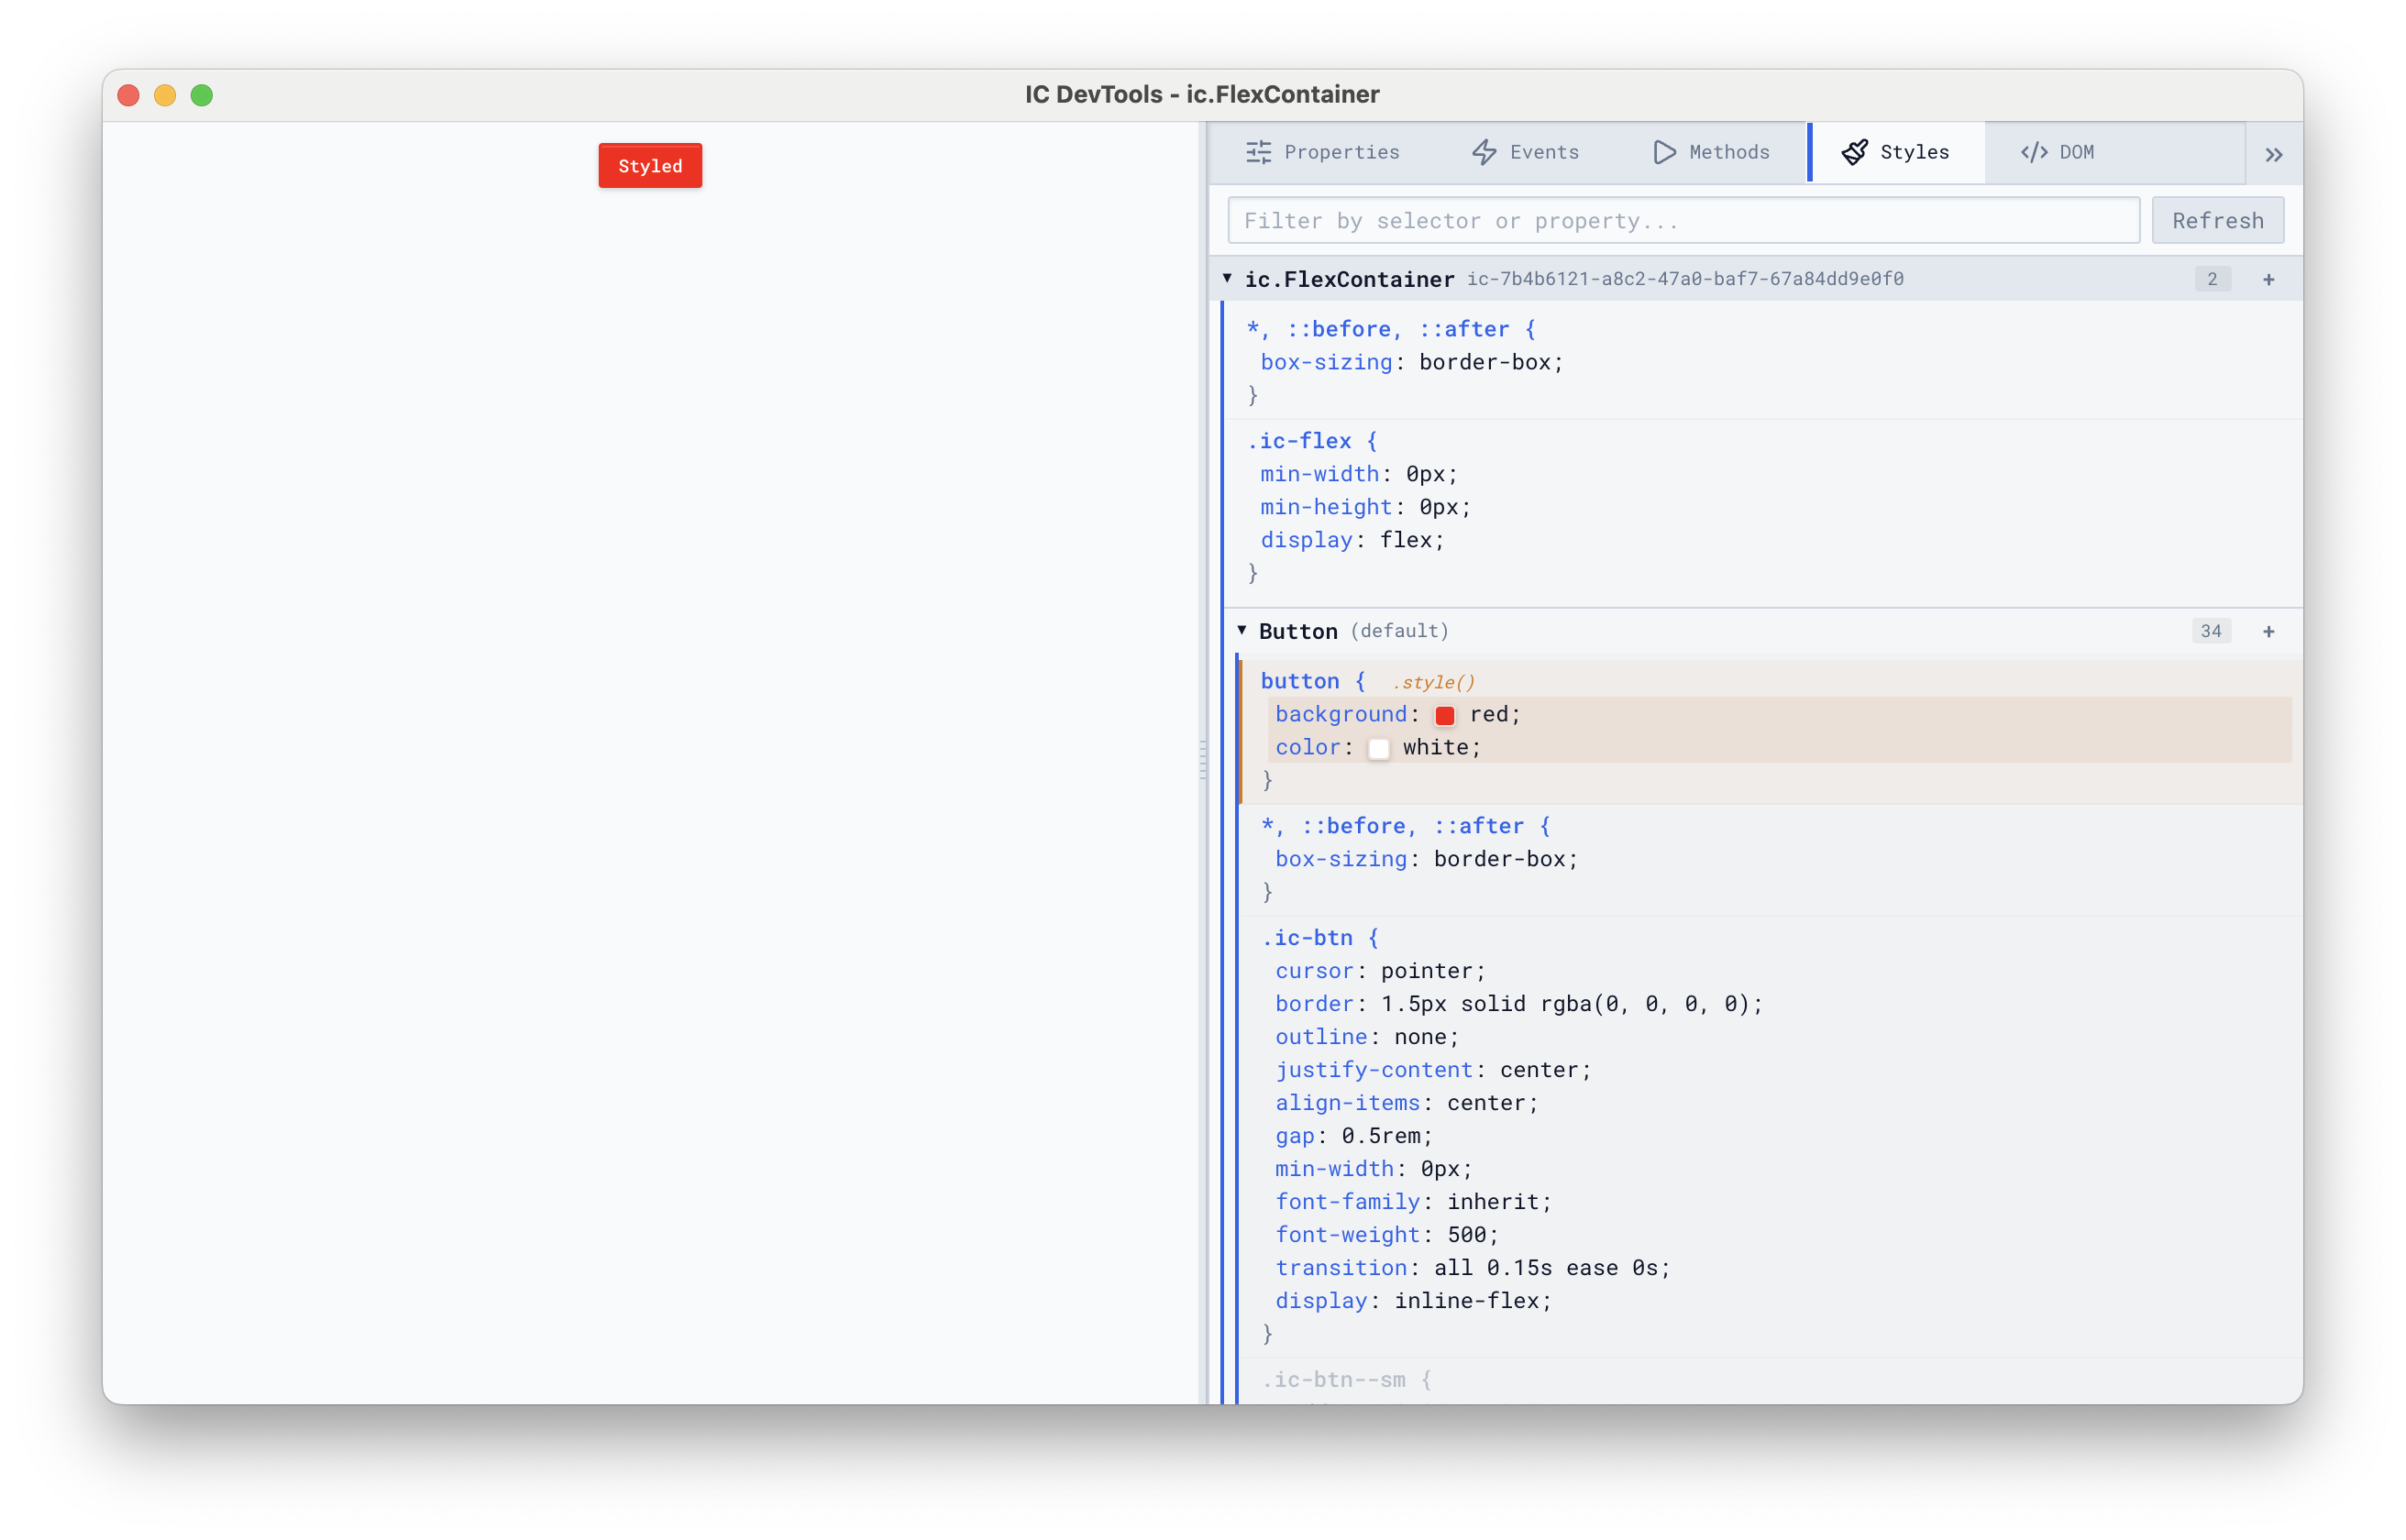
Dynamic properties are highlighted, and properties overridden by a higher-priority rule show a strikethrough. You can double-click any rule to edit it live, and use the color picker for color values.
CSS custom properties (--my-var) can also be added and edited through the Styles tab.
DOM
The DOM tab is a tree inspector similar to the Elements panel in Chrome DevTools. It shows the full DOM structure of the component, with syntax-colored tags and attributes. You can:
- Expand and collapse nodes to explore the tree
- Hover over a node to highlight it in the component preview
- Use the element picker (crosshair icon) to click on an element in the preview and jump to it in the tree
- View CSS rules for the selected element in the bottom section
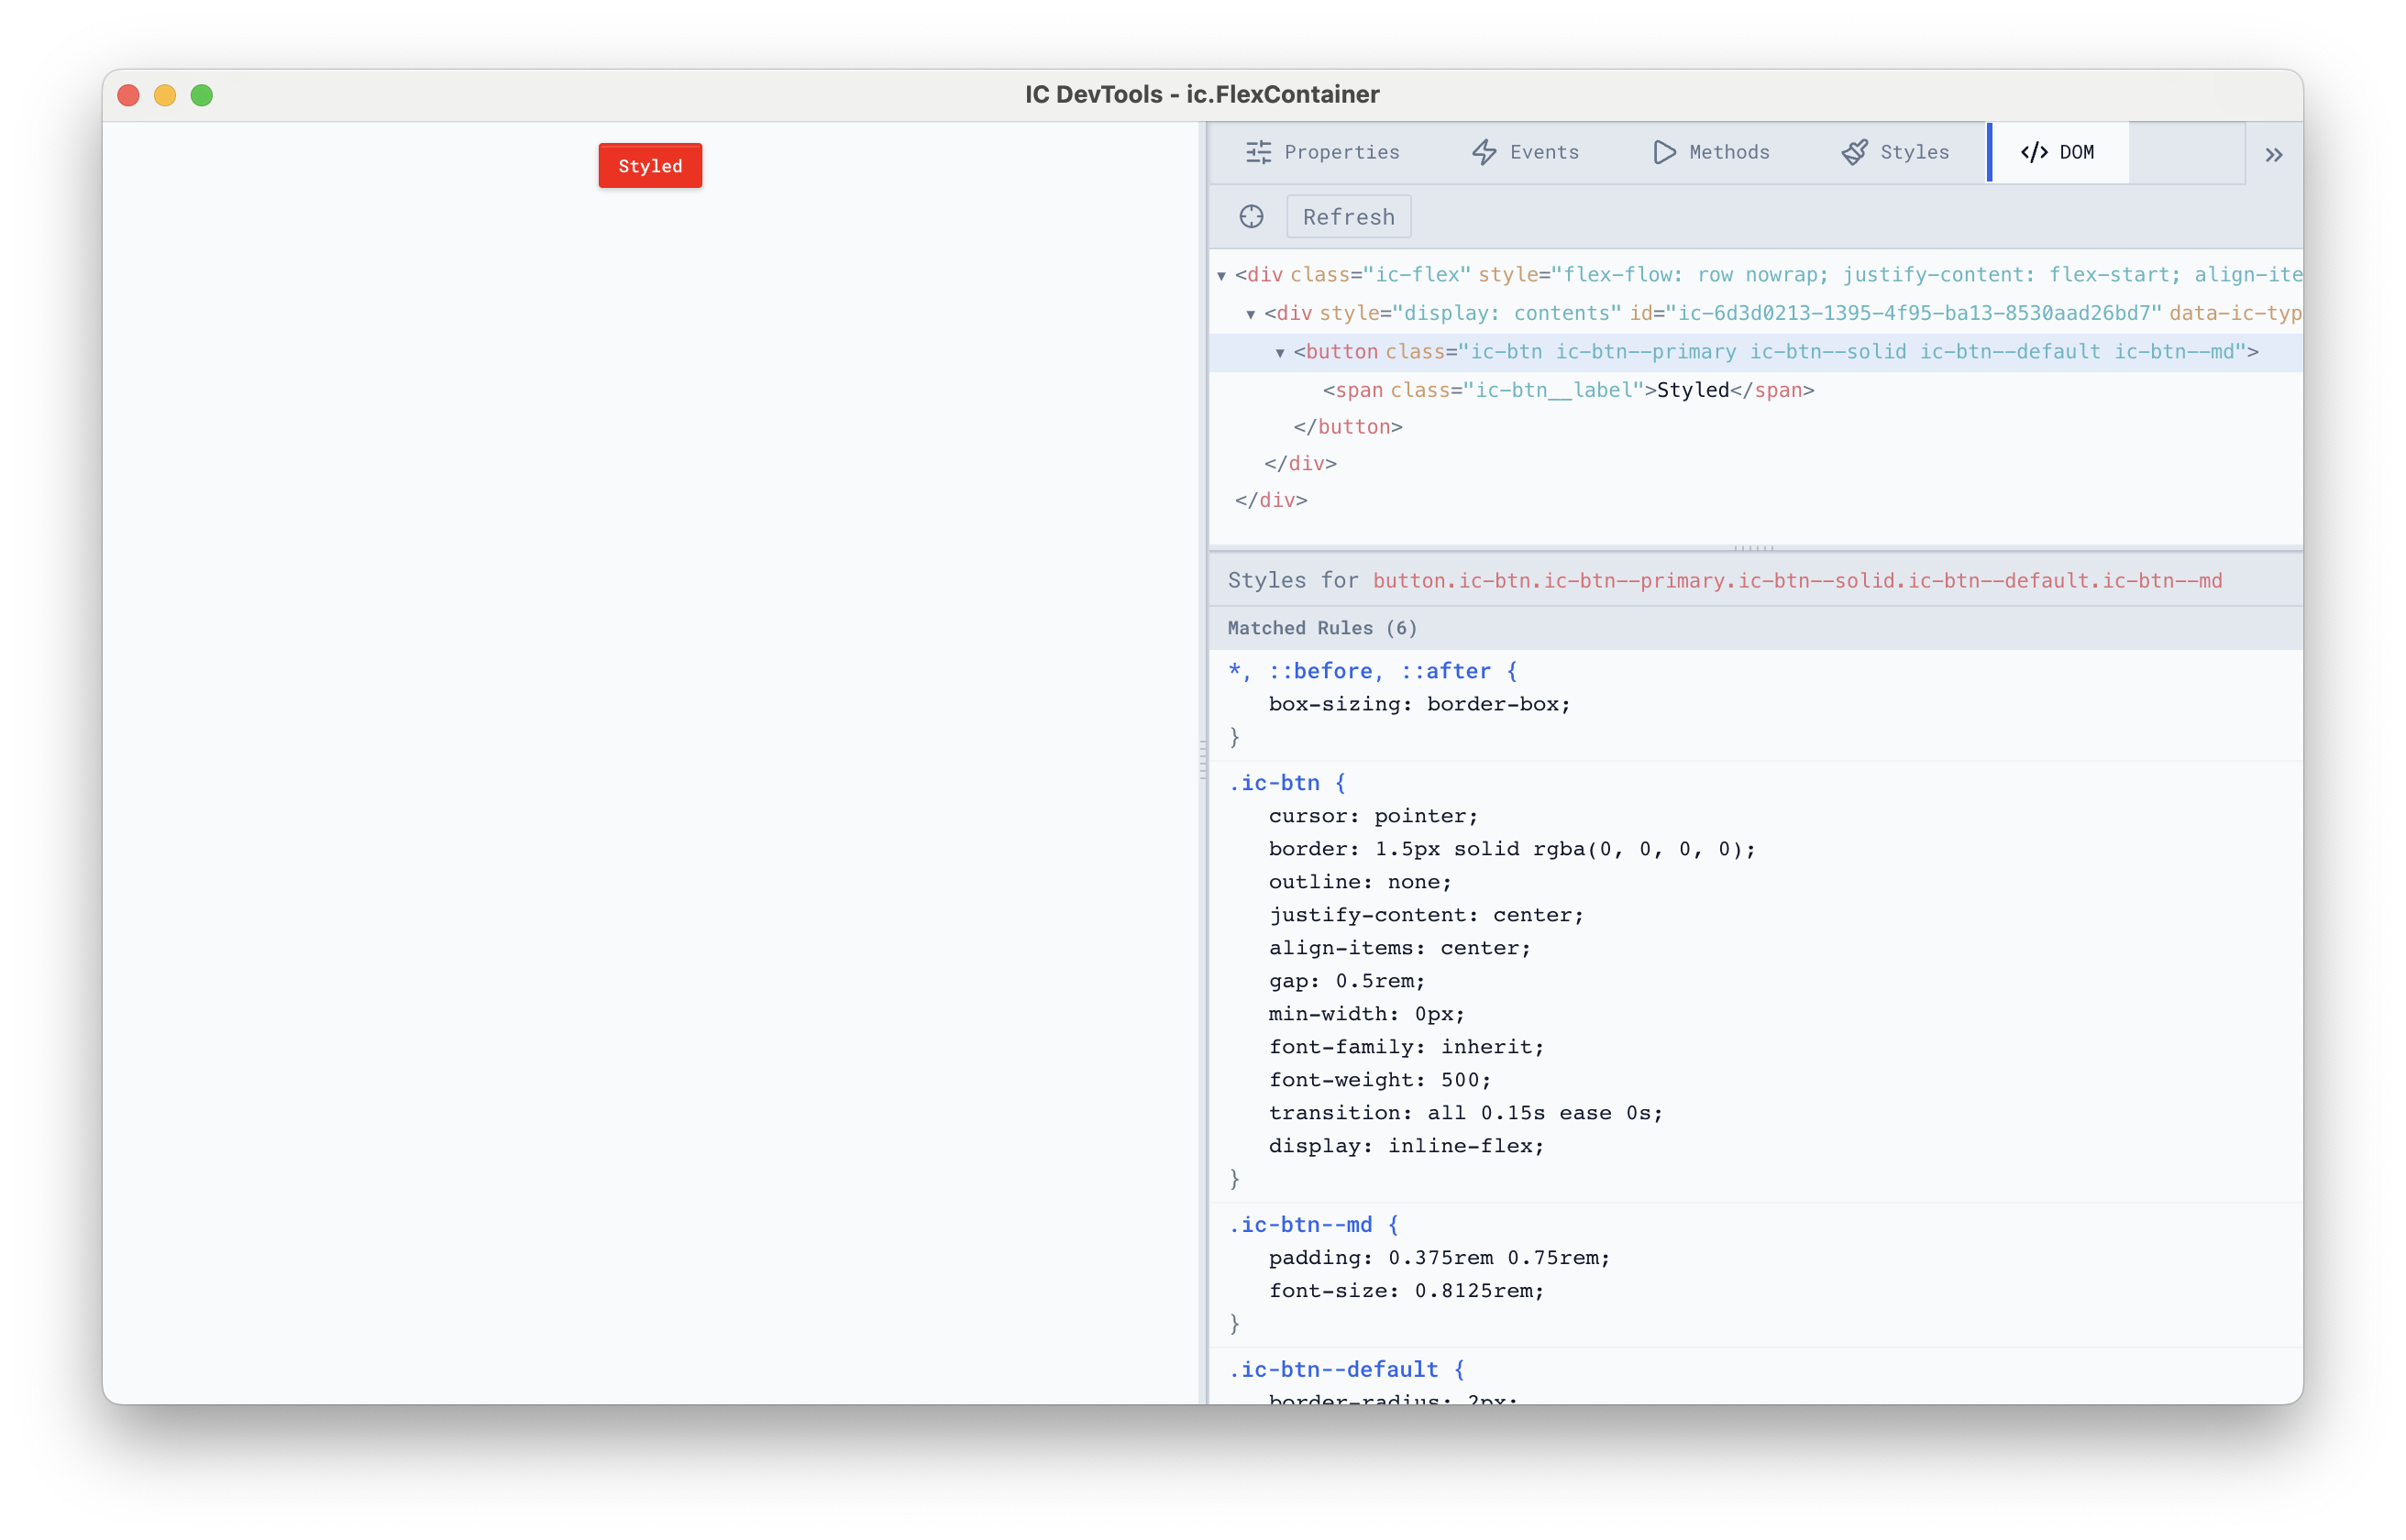
This is the best way to discover what selectors to use when styling a component with css.style().
Console
The Console tab is a MATLAB command line scoped to the inspected component. The console also captures all IC framework log entries (when frame.Debug is true), displaying them with level indicators and source module names. You can filter by level and search by text, just like the Logging system.
The variable comp is always bound to the component used to launch the developer tools. You you can read and write its properties, call methods, and apply styles directly. Variables you create in the console also persist across commands within the same session.